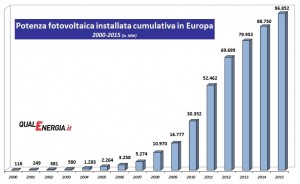
These days will be overcome in Europe the threshold of 100 GW photovoltaic.
Solo 10 years ago the power from the PV was slightly higher 3 GW. A fine 2006, photovoltaic capacity in operation in Europe was just 3,3 GW. Until then, he reasoned on its growth only in terms of megawatts. Then the growth rate is gradually increased: in 2010 the installed barely exceeded quota 30 GW, up to reaching important thresholds in subsequent years. In the bottom graph shows the cumulative PV power produced by 2000 To date in Europe (sources: Solar Power Europe e Iea).
The estimate of achievement of 100 GW gives the size of a considerable growth of solar in the continent, although now registers an annual decline of installed compared to other emerging countries, It remains the most solarized area of the planet. Just think that in the end 2015 the cumulative installed PV in the world It hovers almost on 230 GW.
The push in Europe is mainly coming from strong cost reduction (approximately 80% compared to 10 years), together with a regulatory and incentive framework favorably in the years between the last decade and this, especially in Germany and Italy before later.
In 2015, after three years of decline, followed to record 2011, the European photovoltaics started to grow slightly: They have been installed 8,1 GW (il 75% in Great Britain, Germany and France), quasi il 15% more respect to 6,95 GW of the previous year (source: SolarPower Europe). Worldwide, the annual increase was instead of 25% (added 50 MW photovoltaic). In the graph below the trend of annual installed capacity in Europe by 2000.
nearly 60% the installed in Europe at the end 2015 It is in Italy and Germany. Our country, infatti, with its almost 19 GW is in second place after Germany, which reached 40 GW. then follow UK (9 GW), Francia (6,7 GW) and Spain (5,4 GW). This now covers the PV park 4% of the electricity needs in the continent. Italy holds the record with 7,8% of electricity demand met by solar photovoltaic.

.
